 Some of you may not be tickled by my ticker (a little javascript running near the top of this page, featuring the latest weather data from right up on the roof), but for me it is a glorified place where science meets romance. My husband asked me what I wanted for my birthday, and I said, "Either a WeatherStation or for Google Earth to become real time." In both cases, the additional data streams were intended to let me watch over the girls in their rooftop hives, and to pump that data both onto this blog and into an archive.
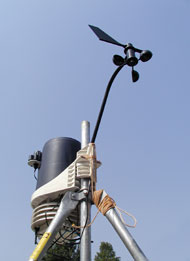
 The weather station totally rocks: It's a Davis Vantage Pro 2 with anemometer (wind), barometer (air pressure), rain collector, thermometer, humidity gauge, and RF wireless transmitter. It is solar powered, with a backup battery for cloudy days. If you live within 1000 feet of me, you can pick up my data, too. Hey, what's confidential about the weather??
There's more to this weather data thing than obsession with what the bees are dealing with today (though there certainly is that). You all know that this seems like a swarm-y year, and that the queens seem to have been superceded more than I thought they would. Earlier this year, I had a theory that early Spring resembled late August, and maybe the girls were being tricked into wrongful behavior by untimely drought and temperature triggers. Well, every theory needs a little data, and that means collecting temperature and precipitation and daylight and all that groovy information.
Please relax: I will not put you through discussions like "Barometric Pressure, Then and Now." But I will, over time, and if my hard drive does not crash, understand just how hot or cold it gets up there, and how rooftop life compares to that of my ground-bound colonies. I'm still kind of hoping to get a comparison of honey yields between the city and suburban sites, but this is not a fair year to do it — some colonies were split, others were just started, and one got mammoth reinforcements.
It will be interesting to see if there ever is a year (or a bee yard) that can be compared fairly to another, or whether I am going to have to learn to see more nuanced patterns.
One thing I can tell you is that this July has been HOT HOT HOT, the third hottest on the weather service records, but the only one from which I have any data at all. If you want to look at a bigger feed than the ticker, take a look at www.tonitoni.org/weather/Current_Vantage_Pro.htm. I have not had time to make it pretty yet. I'll post a monthly archive page when we have been up a whole month!
1 comment:
WOW! That is one nice setup. Great for remote monitoring of your hives to ensure the "girls" are safe and sound. I'm interested in the data you can collect over time to determine trends, etc... Maybe this correlates to hive productivity, swarming tendencies, etc....
Post a Comment